
What is data collection?
Data collection is the process of gathering, quantifying, and assessing information using a range of well-established, systematic methods that ensure research integrity. Data that is collected can be used by a researcher to validate or challenge a hypothesis, evaluate an outcome, or simply observe phenomena. Therefore, data is often a primary component of any research strategy, regardless of the field of study.
In business settings, data is often the backbone of decision making, the lifeblood of operations, and often provides a competitive advantage if collected and processed properly. The phrase ‘data-driven company’ has become very popular in recent years to explain businesses that place data front-and-centre. At Magpi, we work with hundreds of the world’s largest companies and organizations to provide highly customizable data collection tools to help bring data into the heart of their business. But Magpi’s use extends well beyond that: Magpi is used by the UN to track polio outbreaks in Africa, as well as by The Smithsonian to track wildlife mortality rates, and in many operational circumstances in the private sector. As a result, we’ve built our mobile data collection toolset with the help of thousands of researchers to ensure complete flexibility and customization to meet your data collection objectives.
Examples of qualitative data collection:
Participant observation
Interviews/focus groups
Archival research
Field studies
Ethnographies
Content analysis
Biographies
Examples of quantitative data collection:
Online or mobile surveys and polls
Longitudinal studies
Variable analysis
Data collection objectives

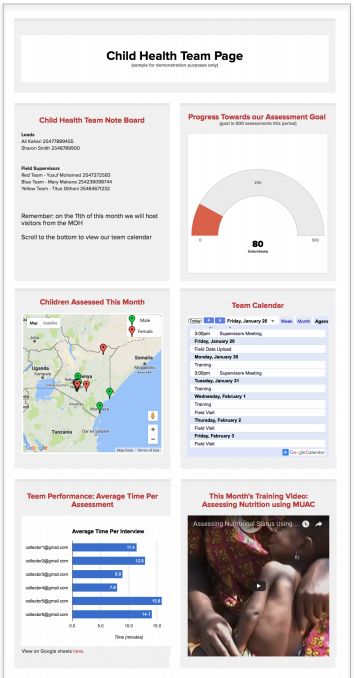
Magpi web app data visualization dashboard
Given the implications of poorly executed data collection, it is imperative to collect data that is sourced correctly and processed accurately. Otherwise, you run the risk of poor decision making and research evaluation is compromised.
As a researcher or data collector, it is your responsibility to set clear objectives upfront. If you are conducting research, for instance, it is often recommended to set clear hypotheses and use data to test these hypotheses. In commercial settings, where data is collected for operational purposes such as equipment inspections or progress reports, establishing clear metrics, as well as frameworks for data collection and scheduling, need to be established to standardise reporting. Otherwise, the integrity of your data is compromised.
Magpi’s data visualization dashboard is one example where administrators can store project schedules, calendars, reports,checklists, and more to ensure all team members are coordinated through one centralized hub.
How to collect data
The data collection method you choose will be highly dependent on the type of data you’re collecting. For this article, we’ll focus on in-field research and commercial data collection, such as operational tests and progress reports.

1. Select a data collection tool
Choosing the right software to conduct your data collection is critical. In most cases, the underlying tool to systemize data capturing is a form. This is important as it enables you to create fields - such as free text boxes, radio buttons, checkboxes, photos, barcodes, signatures, or other forms of data to record observations, interviews, responses, and important metrics in the field.
As your sample size gets larger, forms will ensure the data captured follows a systematic framework. You can try out Magpi’s easy and highly customizable form builder for free, following this link. It also means that the mode of data collection is subject to little interpretation. Researchers or respondents simply insert data following the logic of the form.
2. Document objectives and protocols
To ensure quality assurance and control, it’s imperative that you document clear objectives of the data collection and the protocols around the process. This is such an important part of successfully implementing data collection, that we’ve dedicated a chapter to it towards the end of this article.
However, in short, clear documentation ensures less subjectivity around the way data is collected and processed, to protect the integrity of data and standardize the methodologies chosen to conduct research.
3. Conduct in-field data collection
Once you have your means for collecting data established, such as a mobile data collection tool and the protocols around capturing the data, it’s time to equip researchers with the right instruments to carry out in-field research.
For Magpi’s users, the adaptability of the tool allows for a range of in-field use, administered from a central online portal. The administrator can simply assign researchers with the forms relevant to their mission through the mobile applications.
Here are some case studies of data collection in action using Magpi in various contexts:
4. Process and store data
While data is collected, as well as afterwards, it needs to be safely sent and stored for processing. For NGOs, governments, enterprises and businesses, confidentiality is often an important component of data collection. For this reason, choosing a data collection tool with encryption is crucial.
Furthermore, for data collection that follows a monitoring and evaluation methodology, continuous monitoring requires steadfast systems in place to ensure consistent data recording practices.
Our team has written an in-depth Monitoring and Evaluation Guide that you can download here.
How to store data
Storing data that you have collected in the field is implemented using a data management platform. Whether it’s a standalone research project or an on-going data collection operation involving continuous monitoring, it’s crucial to choose the right data management platform.
The first consideration for data storage is the database. A database is an organized collection of structured information, or data, typically stored electronically in a computer system. A database is usually controlled by a database management system (DBMS). Together, the data and the DBMS, along with the applications that are associated with them, are referred to as a database system, often shortened to just databases.
Data within the most common types of databases in operation today are typically modeled in rows and columns in a series of tables to make processing and data querying efficient. The data can then be easily accessed, managed, modified, updated, controlled, and organized. Most databases use structured query language (SQL1 ) for writing and querying data2 . Most often, we will first need to collect the data that goes into a database.
A simple example of data collection is when you meet a friend, and you enter her / his name and phone number in your phone.
When we read that newborn mortality rate in a country has gone down by 20%, we may ponder how this data was obtained. Or when we hear that the percentage of children under age five who had diarrhoea in the prior two weeks declined from 72% to 33%, we may ask, how was this calculation derived?
These types of statistics and other similar information result from “monitoring and evaluation” or “M&E'' efforts. M&E is the process by which data are collected and analyzed in order to provide information to policy makers, program managers, and the public, for use in program planning and project management.
Monitoring of a program or intervention involves the collection of routine data that measure progress toward achieving program objectives. It is used to track changes in program performance over time. Its purpose is to enable stakeholders to make informed decisions regarding the effectiveness of programs and the efficient use of resources.
Monitoring is occasionally referred to as process evaluation, due to its focus on the implementation process and attempt to answer such key questions as: How well has the program been implemented? How much does implementation vary from site to site? Did the program reach its intended beneficiaries? At what cost?
Evaluation measures how well the program activities have met expected objectives and/or the extent to which changes in outcomes can be attributed to the program or intervention. The difference in the outcome of interest between having or not having the program or intervention is known as its “impact,” and measuring this difference is commonly referred to as “impact evaluation.”
How to visualize data
In most cases, raw data presented in a database is of little use to decision making. Trends, graphics, heat-maps and charts bring data to life. Indeed, visualization data is a way to tell a story and as a research or data collection administrator, it is your responsibility to ensure the data is presented properly.
Thanks to huge advancements in data processing technology, there are a wide variety of ways you can visualize your data.
Here are a few ways you can visualize data that you’ve collected:
Magpi Data Visualization Dashboard
Right from inside Magpi, you can set up rich data visuals that update in real-time as data is collected in the field.
You can also embed custom HTML elements into your dashboard, to pull from your database or third-party data visualization vendors such as those listed below. We have published a published Report & Dashboard Guide outlining the report and data-visualization process in Magpi.
Tableau is a popular and powerful tool for querying relational databases, analytics, cloud databases, spreadsheets and more, to generate rich, highly customizable reports and visuals. Users can install in-memory data engines to process data on-the-go, and integrate with a range of other tools and APIs.
Magpi’s native highly customizable data dashboard

Data collection Integrity
The degree to which faulty data can harm your data collection objectives can be disproportionately large depending on how your data is being used. As a result, it is important to uphold a strict standard of data collection integrity in both research methodology as well as in execution and processing.
Poorly collected data can:
Compromise the conclusions drawn from research
Threaten the ability to repeat and test research
Mislead decision-makers
Cause harm to participants, particularly if privacy is breached
Distort processing
How to preserve data integrity
A proactive stance towards research integrity is required to prevent problems around data collection. Where reactive measures are expensive and often require research to be repeated, preventative measures ensure data integrity is ingrained as part of the overall strategy.
Issues around data integrity may be intentional, such as those found when conducting in-field qualitative research, or unintentional, such as the systematic or random errors that occur when collecting and processing data.
Researchers describe ‘quality assurance’ and ‘quality control’ as two techniques that can protect data integrity. On the one hand, quality assurance focuses on activities researchers or administrators can implement before data collection begins, such as defining collection processes. On the other hand, quality control references actions that can be taken during or after the research has been conducted. An administrator should utilise both approaches when considering their data collection plan.
Planning data collection with quality assurance in mind
When planning an operation to collect data, be it in-field, online or over the phone, quality assurance focuses on the preventative measures one can take to avoid jeopardizing the integrity of data collected.
An important component of this is standardizing protocols around how data is collected. Administrators should develop comprehensive manuals for carrying out research, particularly if there are multiple researchers in the field. This eliminates subjectivity or interpretation of how the research should be carried out, and therefore preserves the quality of data collected.
Data collection protocols should remove uncertainty around:
The instruments, procedures, and timing of data collection
The purpose of collecting data
How data should be codified and stored
Who should collect and have access to data
Who is responsible for data collection
How data is documented for future access
Who is responsible for administering and updating data collection protocols
By focusing on creating clear and concise documentation upfront, it ensures all actors and stakeholders are aware of how data is collected. The emergence of mobile data collection processes has given rise to new standards of quality assurance, standardization, and collection procedures.
Using digital forms, researchers can set up structured processes for collecting data - regardless of whether it’s qualitative or quantitative. This ensures that the way data is added is consistent and standardised, and data collection can be quickly scaled to multiple researchers or sent out digitally using applications.
Magpi’s mobile data collection tool enables you to quickly customize forms with an array of field-types, conditional logic and data inputs, including SMS and Interactive Voice Recording (IVR).
We have a free checklist for mobile data collection available for download here.
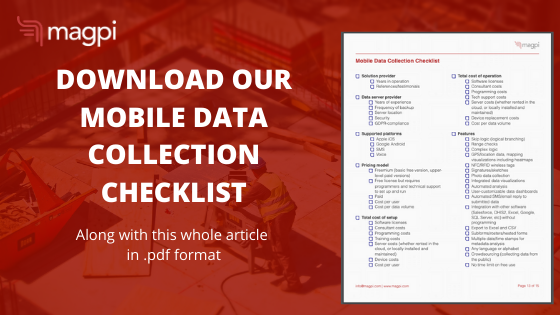
Mobile Data Collection Checklist
Ensuring data integrity using quality control mechanisms
Regardless of the setting you may be collecting data in, and the purpose behind it, once you begin collecting data it is imperative that you have quality control measures in place to protect the way you are sourcing and processing data. This is particularly important if you’re an administrator for an organization or company where there are multiple principal investigators conducting your data collection strategy.
For larger data collection operations, quality control systems lookout for individual errors in research, systematic errors in the way the protocols are being implemented, site performance, fraud or scientific misconduct. Often, this involves sending out administrators to oversee data collection, observing real-time updates in the results to look out for data anomalies, and replicating the research to see if the results are consistent. Magpi’s data reporting updates in real-time, allowing administrators to quickly see an overview of the data that is being collected in the field, and send feedback to researchers from the online platform.